Website Conversion Rate Benchmarks for Small Business in 2026: What's Actually Good?

Table of Contents
TL;DR — Quick Hits
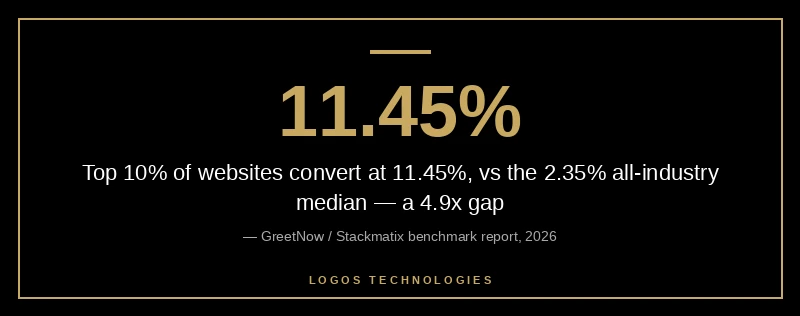
- The 2026 median website conversion rate across all industries is 2.35%. The top 10% hit 11.45% — a 4.9x gap that keeps widening.
- For small business service sites, 3%+ on form submissions is strong; 5%+ on a focused landing page is excellent.
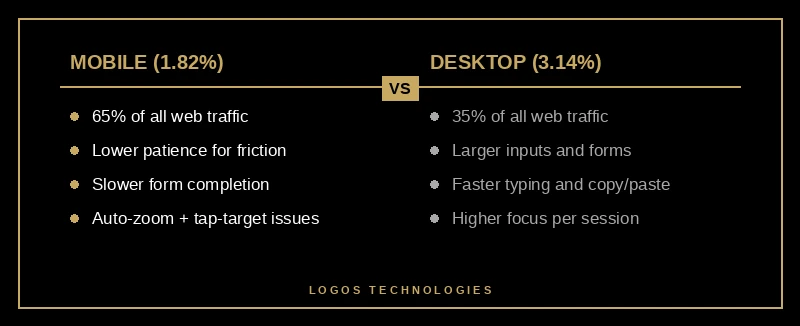
- Mobile converts at 1.82% vs desktop's 3.14% — a 42% gap, up from 38% in 2024 despite "mobile-first" being a decade old.
- Visitors from ChatGPT and Perplexity convert at 3.49% vs 2.86% from traditional organic search — AI search is now your highest-intent traffic source.
- Benchmarks are useless without context. The right question isn't "is 2.5% good?" — it's "what's the top quartile for my industry, traffic source, and conversion event?"
When a small business owner asks me whether their website is "performing well," what they really want is a benchmark. A number to compare against. Something concrete that tells them whether the site they paid for is actually doing its job — or whether they should be frustrated.
The numbers are out there, but most published benchmarks lump every site type together: a $20 t-shirt store, a $500K B2B SaaS funnel, and a local plumber's contact form all averaged into a single percentage. That's how you end up with an "industry average" that means nothing for your business. This guide cuts through that noise with current 2026 data, broken down by what actually matters for a small business: traffic source, device, and conversion event type.
What Is the Average Website Conversion Rate in 2026?
The 2026 global median website conversion rate is 2.35% across all industries, while the top 10% of sites convert at 11.45%, according to multiple aggregated benchmark reports. The gap between average and excellent has grown about 5x since 2022 — meaning the difference between a "decent" site and a great one is now bigger than the difference between having a website and not having one at all.
That headline number hides a lot of variation. Conversion rate depends on three things: what your "conversion" actually is (purchase, lead form, phone call, email signup), what industry you're in, and where the visitor came from. A 2% conversion rate is mediocre for a free email newsletter signup but extraordinary for a $40,000 SaaS contract.
For small businesses specifically, the realistic targets break down like this. Service businesses — contractors, dentists, lawyers, agencies — should aim for 3-5% on contact form submissions and consultation requests. E-commerce averages 1.89% all-industry, with 3%+ marking you as above average and 5%+ putting you in the top quartile, per Shopify's ecommerce conversion data. B2B lead generation sites should target 3-5% on form submissions; anything above 5% on a high-intent demo request page is excellent. Landing pages — focused single-purpose conversion pages — typically convert at 5-10%, with the best performers hitting 20%+.
If you're tracking your own numbers and you're sitting at 1-2%, you're not failing. You're average. But "average" is also the most expensive place to be, because it's where you're spending the most on traffic without seeing the conversion lift that justifies it. That's the gap a strong website ROI calculation should make visible.
Why Industry Benchmarks Are Misleading on Their Own
Benchmark posts love to publish a clean table: "Restaurants convert at 4.5%, B2B converts at 2.1%, ecommerce converts at 1.9%." The problem is that the industry tag tells you almost nothing about what's actually driving the rate.
A boutique apparel store running paid Instagram ads and a contractor running Google Local Service Ads are both technically "small businesses with websites." Their benchmarks have nothing in common. The contractor's traffic is high-intent — someone whose pipe is currently leaking. The apparel store's traffic is browsing-intent — someone scrolling at lunch. Same metric, completely different context.
The right way to use benchmarks is to triangulate three variables at once: industry vertical, traffic source, and conversion event. Once you anchor all three, the benchmark becomes useful. Without those anchors, you're comparing a fish to a bicycle.
There's also a real problem with how benchmarks are sourced. Most public reports pull from large platforms (Shopify, HubSpot, Google Ads), which skews the data toward larger and better-resourced sites. The local plumber with a 12-page website built in 2019 is not in that dataset. Their realistic benchmark is whatever shape their own analytics show, compared to the same business's numbers six months ago. We dig into the specific numbers worth tracking in our breakdown of website analytics metrics that actually matter.
The Mobile Conversion Gap Is Getting Worse, Not Better
Here's a finding that surprises most business owners: mobile traffic accounts for roughly 65% of website visits in 2026 but converts at just 1.82%, compared to desktop's 3.14%. The mobile/desktop gap was 38% in 2024. It's now 42%. Despite a decade of "mobile-first" rhetoric, the gap is widening.
The reasons are mostly mechanical, not theoretical. Mobile users are usually multitasking — on a couch, in a waiting room, between meetings — and have lower patience for friction. A form that takes 90 seconds on desktop takes 3 minutes on a phone, and most of that extra time is spent fighting auto-zoom, mistyping in tight inputs, and waiting for slow assets to load.
This is where website performance stops being a "nice to have" and becomes the single biggest conversion lever you have. Google's Core Web Vitals data consistently shows that sites meeting all three CWV thresholds see roughly 24% lower abandonment than sites that don't. That maps almost perfectly onto the 42% mobile/desktop gap when you back out the mobile-only friction. We covered the architecture decisions that lock in mobile speed in fast website design: speed built in, not bolted on, and the specific Core Web Vitals fixes most sites need are in the Core Web Vitals 2026 update guide.
The practical takeaway: your "real" mobile conversion benchmark should be set against your desktop rate, not against an industry average. If desktop converts at 4% and mobile converts at 2%, you have a UX problem, not a market problem. If desktop converts at 4% and mobile converts at 3.5%, you have a well-built site.
What Counts as a Good Conversion Rate for a Small Business Service Site?
For small business service sites — the kind LOGOS Technologies builds for contractors, professionals, and local businesses — a "good" conversion rate has a few different definitions depending on what you're measuring. Form submissions are the most common conversion event. The realistic benchmark is 3% on a contact form, 5%+ on a quote-request page, and 8-10%+ on a focused landing page tied to a single ad campaign. Phone-call clicks (tracked via the tel: link) typically run 1.5-3% on mobile. Newsletter signups should hit 1-2% if the offer is generic and 4%+ if it's specific (e.g., "Free contractor pricing guide for kitchen remodels").
The most common mistake I see is conflating these into one number. A 2% site-wide conversion rate could mean a 0.5% form submission rate plus a 1.5% newsletter signup rate (good newsletter, broken form), or it could be 2% on the contact form with no newsletter at all (decent form, leaving signup volume on the table). Without breaking it apart, you can't fix what's broken.
The other thing to watch is conversion rate by traffic source. As of 2026, traffic from AI search engines like ChatGPT, Perplexity, and Google's AI Overviews converts at 3.49% compared to 2.86% from traditional organic search, per current cross-platform analytics data. That's a 22% lift. The reason is intent: someone who clicked a citation in an AI answer has already had their question pre-qualified by the LLM. They arrive ready to buy, hire, or schedule. Optimizing your content to be the citation source — what's now called generative engine optimization — is one of the highest-leverage moves a small business site can make in 2026.
How Do I Improve My Website's Conversion Rate?
The brute-force answer: find your single biggest friction point and remove it. The data-backed answer: pick conversion levers based on which constraint is binding for your specific site.
If your site is slow (LCP over 2.5s, INP over 200ms), nothing else matters until that's fixed. Page speed is the upstream constraint — every other CRO tactic compounds against it. Once speed is in order, the next-biggest levers are usually clarity of the offer, trust signals (reviews, credentials, photos), and reducing form friction (number of fields, autofill compatibility, mobile keyboard types). The tactics that show up in nearly every meta-analysis as having the largest effect sizes are simplifying the value proposition above the fold, adding social proof near the conversion action, and reducing form fields to the minimum the business genuinely needs to follow up. We walk through the full sequence in our website conversion optimization deep dive and the landing page design playbook.
The thing that won't work — and that I see small business owners try first about 80% of the time — is a redesign. New colors, new fonts, new hero image. None of that fixes the underlying conversion problem unless the original design was actively hostile to users. A complete redesign is the right move when the existing site is unsalvageable structurally, not when the existing site is just slow or unclear.
Frequently Asked Questions
What's a good conversion rate for a small business website?
For small business service sites, 3% on a contact form, 5%+ on a quote page, and 8-10%+ on a focused landing page are realistic targets. Ecommerce should aim for 3%+ overall. The all-industry median is 2.35%, so anything above 3% puts you above average. Top quartile performers hit 5-11%+ depending on industry and conversion event.
How do I calculate my website's conversion rate?
Conversion rate = (number of conversions ÷ number of unique visitors) × 100. The trap is defining "conversion" too broadly. Track each conversion event separately — form submissions, phone clicks, newsletter signups, purchases — because the optimization moves are different for each. A site-wide conversion rate that lumps them together hides which lever is actually broken.
Why does mobile convert lower than desktop?
Mobile converts about 42% lower than desktop in 2026 (1.82% vs 3.14%) primarily because mobile users have less patience for friction: slow-loading pages, awkward forms, small tap targets, and split attention. The gap is widening, not closing. Fix mobile-specific friction (page speed, form field types, viewport scaling) before assuming you have a market problem.
Is 2% a good conversion rate?
2% is approximately the global median, which means it's average — not good, not bad. For a small business service site with high-intent organic traffic, 2% on a contact form means there's room to roughly double the rate by fixing the most common friction sources (slow page load, unclear offer, too many form fields). For ecommerce, 2% is slightly above the 1.89% e-commerce median.
How long does it take to improve a conversion rate?
The biggest wins from technical fixes (page speed, form simplification, mobile UX) typically show up within 2-4 weeks. CRO experiments on copy, layout, and offer typically need 4-8 weeks of traffic to produce statistically meaningful results. Don't trust a single A/B test result on a small sample — small business sites often need to run a test for 2-3 months before the numbers stabilize.
Conclusion
Conversion rate benchmarks are a starting point, not a finish line. The 2.35% median tells you whether your site is in the same ballpark as everyone else's, but it doesn't tell you whether your specific site is performing the way it should. The math you actually need is: what's our top-quartile peer hitting, what's our biggest single friction source, and what does fixing it cost vs. what does ignoring it cost in lost revenue?
If you're staring at analytics and trying to figure out whether your numbers are good, bad, or fixable, that's exactly the conversation we have with most LOGOS Technologies clients before we touch a line of code. We build fast, static, conversion-focused websites for small businesses across Papillion, Nebraska, and nationwide — and we anchor every project to the metrics that actually move the business. Take a look at our web design services or contact us to talk through what your conversion rate is telling you.