Small Business Website Analytics: The Metrics That Actually Matter in 2026

Table of Contents
TL;DR — Quick Hits
- The global average website conversion rate in 2026 is 2.35%; a 3% rate already beats most competitors, and top performers hit 8-12%.
- Google renamed GA4 "Conversions" to "Key Events" in March 2024 — most small business owners still haven't updated their setup.
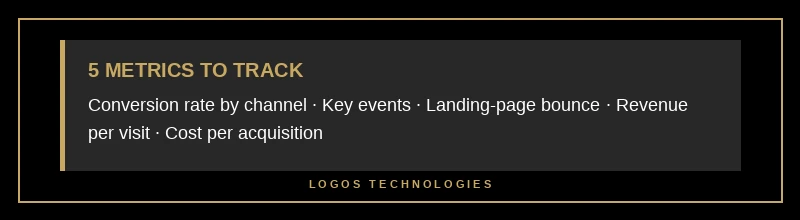
- Track five metrics, not fifty: conversion rate by channel, key events, top landing-page bounce rates, revenue per visit, and cost per acquisition.
- A high bounce rate on a blog post is fine; a high bounce rate on a sales page means you are losing money every day it stays broken.
- Analytics without goals is just counting. If you cannot connect a metric to a dollar, stop tracking it.
Most small business owners have a Google Analytics account, open it maybe twice a year, scroll through a wall of charts, and close the tab. That is not an analytics strategy — that is a subscription to confusion. The practical problem is not that small business owners lack data. The problem is that they have too much of it, none of it is organized around a decision, and nobody ever told them which five numbers actually predict whether their website is making them money.
The fix is simpler than most agencies want you to believe. Proper small business website analytics comes down to deciding which outcomes matter, wiring up the right key events in GA4, and ignoring the rest. This guide walks through exactly which metrics earn their place on your dashboard, how to set them up in 2026, and why most of the charts you have been staring at are vanity.
What is small business website analytics, really?
Small business website analytics is the practice of tracking a short list of visitor behaviors — specifically the ones that connect to revenue — so you can make decisions about marketing spend, page changes, and growth priorities. It is not about tracking "everything Google Analytics can measure." Vanity metrics like total pageviews, total sessions, and follower counts look impressive but do not tell you whether the business is growing, which is why Shopify explicitly warns against them in its vanity metrics guide.
The practical test for whether a metric belongs on your dashboard is brutal: can you point to a dollar it would earn or save you if the number went up or down? If not, delete it. Tracking what matters is a core part of the broader discipline we covered in our guide to measuring website ROI for small business — analytics is the instrumentation layer; ROI is what it is supposed to reveal.
The five small business website metrics that actually matter
You do not need a twenty-KPI dashboard. You need five numbers, reviewed weekly, that directly connect to business outcomes. The following set is what we configure for most LOGOS Technologies clients, and it covers roughly 90% of the decisions a small business owner actually has to make about their website.
1. Conversion rate by channel. Not overall conversion rate — by channel. Organic search visitors often convert better than social traffic because they are actively searching for a solution. If your overall rate is 2% but organic converts at 5% and paid social converts at 0.4%, the decision writes itself: shift budget into SEO and fix the paid funnel or kill it.
2. Key events (formerly called "Conversions" in GA4 before Google's March 2024 rename, which many guides still have not caught up with). For a marketing site this means form submissions, phone-number clicks, calendar bookings — the actions that actually generate leads. Google's own GA4 documentation recommends marking 3-5 strong key events rather than twenty micro-events; if everything is "key," nothing is.
3. Top landing-page bounce rate and engagement rate. Not sitewide bounce rate — per landing page. A 75% bounce rate on a blog post where the visitor got their answer is fine. A 75% bounce rate on your pricing page means you are bleeding leads. The industry-average bounce rate sits between 20–45% for e-commerce, 35–55% for SaaS, and 70–90% for blogs, so context is everything.
4. Revenue per visit (or lead value per visit). Multiply your conversion rate by average deal size divided by visits. This single number tells you what a visitor is worth, which tells you what you can afford to spend to get one.
5. Cost per acquisition (CPA). Total channel spend divided by conversions from that channel. If CPA exceeds lifetime value, you are literally paying to lose money. Most small businesses never calculate this and then wonder why their ad budget disappears every month.
How do I set up GA4 conversion tracking for a small business website?
Setting up GA4 key events for a small business takes about twenty minutes once the site is tagged. The exact path in the 2026 interface is Admin → Data Display → Events, then click the three-dot menu next to the event you want to promote and select "Mark as key event." For form submissions specifically, you either use GA4's built-in "form_start" and "form_submit" events (on by default when Enhanced Measurement is enabled) or push a custom event from the form's success handler.
For a typical LOGOS Technologies client — a service business generating inbound leads — the five key events we configure look like this: generate_lead on form submission, contact on phone-number click, schedule on calendar booking, file_download on gated PDF, and scroll_90 on deep engagement with a sales page. That is it. No twenty-event monstrosity — five events, each tied to a real business outcome.

One architectural note that rarely gets mentioned: static sites like those we build at LOGOS Technologies produce cleaner analytics data than WordPress or page-builder sites. No surprise plugin-injected events, no duplicate pageview fires from tracking scripts stacking on each other, no bot traffic inflating numbers because there is no login page or xmlrpc endpoint to pound on. If your analytics look noisy, the platform under them might be the cause — see our guide to why WordPress alternatives like static sites win on SEO and performance for the fuller picture.
The metrics to stop staring at
Certain metrics are the analytics equivalent of cable news — they create the illusion of information while teaching you nothing. Three to retire:
- Total pageviews with no context. Pageviews only matter as a ratio against conversions. A 50% pageview drop with a 20% conversion increase is a win.
- Average session duration across the whole site. Averages hide everything. A visitor spending ten minutes on your 404 page is a disaster, not engagement.
- Bounce rate at the sitewide level. Per-page bounce is useful; sitewide bounce is meaningless because it averages across page types with wildly different intents.
The simpler principle: every metric on your dashboard should map to a decision you might make this month. If you cannot name the decision, remove the metric. The same discipline applies when optimizing a website for conversions — you cannot optimize what you cannot cleanly measure.
The page-speed connection small business owners miss
Your analytics data is only as good as the page that loads before it can fire. If a visitor leaves before your GA4 script even loads, that visit never registered at all — which means slow sites systematically under-count their own traffic and over-state their own bounce rate. Google's own Core Web Vitals research shows that every additional second of load time drops conversion rates measurably, and we unpacked the broader economic impact in our writeup of what the page-speed revenue data actually shows.

This is not a throwaway point. If you are looking at a slow WordPress site's analytics, your "real" bounce rate is probably better than what GA4 shows, your "real" conversion denominator is wrong, and your decisions are being made on bad data. Fixing the website fixes the measurement.
Frequently Asked Questions
How often should a small business review website analytics?
Weekly for anomaly detection, monthly for trend review, quarterly for strategic decisions. A weekly check takes ten minutes if your dashboard is set up correctly and catches things like a dropped form, a broken CTA, or a sudden traffic-source shift before they cost you a month of leads.
What is a good conversion rate for a small business website in 2026?
The global average is 2.35% in 2026, and 2-5% is typical for most service businesses. Anything above 3% is above average, and top performers reach 8-12%. Industry matters a lot — compare to your niche, not the global average. Design and speed drive this number more than any copy tweak, which is why a proper lead-generation website that converts is structurally different from a brochure site.
Is Google Analytics 4 enough, or do small businesses need more tools?
For 99% of small businesses, GA4 is enough on its own. You do not need Hotjar, Mixpanel, Amplitude, or a custom data warehouse until you have product-market fit and meaningful traffic. Start simple, track five metrics, and add tools only when a specific decision requires data GA4 cannot give you.
What is the difference between a GA4 event and a key event?
Every tracked interaction in GA4 is an event — pageview, scroll, click, form submit. A key event is any event you explicitly promote (Admin → Events → three-dot menu → Mark as key event) because it represents a business outcome. Key events roll up into your conversion reports; regular events do not. Keep 3-5 key events maximum.
Can I track analytics on a static website?
Yes, and typically more cleanly than on WordPress or other CMS-based sites. Static sites let you control exactly what tracking scripts load and when, which usually means faster pages, fewer duplicate fires, and cleaner data. We embed GA4 into every static website we build at LOGOS Technologies, configured with the five-event setup described above, as part of the standard engagement.
Stop guessing, start measuring
Most small business websites are a black box — the owner hopes it is working, the developer swears it is working, and nobody has a number that actually answers the question. That is fixable in an afternoon. Decide on five outcomes that matter, configure them as GA4 key events, build a one-page weekly dashboard, and cancel the subscription to confusion.
At LOGOS Technologies in Papillion, Nebraska, we build fast static websites for small and mid-sized businesses, and analytics instrumentation is part of every engagement — not an upsell. If you are tired of looking at charts that do not answer any real question, reach out via our contact page or see what we build.