
How to Fix Interaction to Next Paint (INP) in 2026

Table of Contents
TL;DR — Quick Hits
- A "good" INP is 200ms or less at the 75th percentile of real-user interactions; over 500ms is "poor".
- Roughly 43% of websites still fail the 200ms INP threshold per CrUX field data, making INP the most commonly failed Core Web Vital.
- INP replaced First Input Delay in March 2024 and now measures every interaction, not just the first one.
- The fix is almost always JavaScript: break long tasks under 50ms, use
await scheduler.yield(), and move third-party scripts off the main thread. - Static, hand-coded sites pass INP by default because they barely run JavaScript on user input.
If you have spent any time inside Google Search Console in the last year, you have probably watched your green Core Web Vitals turn yellow without changing a thing on your site. The metric flipping the trend is almost always Interaction to Next Paint, or INP — the responsiveness metric Google promoted to a Core Web Vital in March 2024 and that has been quietly dragging down sites built on WordPress, Webflow, Wix, and most page builders ever since.
The numbers are stark. According to Chrome User Experience Report (CrUX) field data summarized by Semrush, around 43% of websites still fail the 200ms INP threshold, making it the single most commonly failed Core Web Vital. By comparison, LCP fails on roughly 38% of mobile pages and CLS on under 20%. INP is now the metric most likely to drop a site out of "good" Core Web Vitals — and Google's page experience documentation confirms it carries the same ranking weight as LCP and CLS. If your traffic has stalled in 2026 and your other vitals look healthy, INP is the place to look first.
What Is Interaction to Next Paint, exactly?
Interaction to Next Paint measures the latency between a user clicking, tapping, or pressing a key on your page and the moment the next frame paints to the screen with the response. The browser captures every interaction during a page visit and reports the worst (or near-worst) one as the page's INP. The thresholds are fixed by Google and apply to the 75th percentile of real-user data:
- Good: 200ms or less
- Needs improvement: 200ms to 500ms
- Poor: over 500ms
INP replaced First Input Delay (FID) as a Core Web Vital because FID measured only the delay before an interaction started running — it did not capture how long the work itself took, or how long the browser took to paint the result. Real users do not care about the gap before processing; they care about the time from clicking a button to the menu actually opening. INP measures that full round trip, which is why most sites that scored "good" on FID now score "poor" on INP without any code change. The metric got harder, not the site.
The technical breakdown matters because the fix changes depending on which phase is slow. INP has three components, documented by the Chrome team: input delay (how long until the event handler starts running), processing time (how long the handler itself takes), and presentation delay (how long the browser takes to paint the resulting frame). On most slow pages, processing time is the killer — long-running JavaScript event handlers that block the main thread.
Why so many websites fail INP
The short answer is JavaScript. INP is a near-perfect proxy for "how much JavaScript runs when the user touches your page," and the modern web has more of it than ever. The 2025 Web Almanac measured a median JavaScript payload of around 615KB on mobile, up year over year, with most of that code coming from third-party plugins, analytics, A/B testing, chat widgets, ad scripts, and tag managers. Every one of those scripts attaches event listeners. Every listener competes for the main thread when a user interacts with the page.

Page builders make this worse, not better. A typical WordPress site with a popular page builder, a contact-form plugin, and a marketing-automation tag manager can ship 20+ third-party scripts before any of your own code runs. When a visitor taps a button, the click event has to wait for whatever script happens to be running on the main thread to finish — and a single script chunk longer than 50ms instantly puts you in "needs improvement" territory. We covered the broader speed picture in our website speed optimization guide for 2026, but for INP specifically the equation is simple: less main-thread JavaScript equals better responsiveness.
The phase that surprises most developers is presentation delay — the time after your event handler runs but before the browser actually paints the new frame. On a page with a huge DOM, complex CSS, or layout-thrashing inside a click handler, this phase alone can blow the INP budget even if the JavaScript itself was fast. This is why INP rewards small, semantic, predictable HTML over deeply nested builder output.
How do you fix INP step by step?
You fix INP by attacking each of the three phases in order. Most sites get the biggest wins from the second phase (processing time), but skipping the first phase is what makes "fixed" sites regress two weeks later.
1. Cut input delay by deferring third-party scripts
Input delay is the gap between a user's tap and your handler getting a chance to run. The cause is almost always background JavaScript that was already executing when the tap arrived. The fix is making sure non-essential scripts are not running during the windows when users interact most — page load, scroll, and form focus.
Concretely: every third-party <script> tag should use defer or async, and anything that does not need to run before first paint should be wrapped in requestIdleCallback. Tag managers, chat widgets, A/B testing libraries, heatmap scripts, and analytics beacons all belong in idle time. The DebugBear INP guide recommends auditing every third-party script against this question: "Does this need to run in the first 3 seconds, or can it wait?" If it can wait, idle-load it.
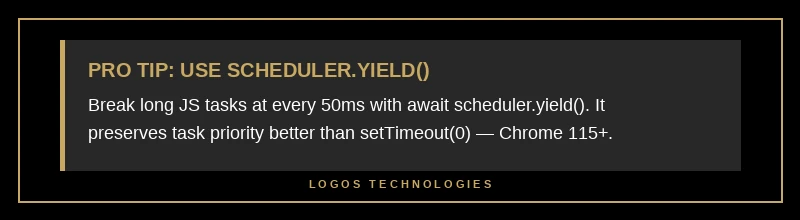
2. Break long tasks with scheduler.yield()
Processing time is where most INP fixes live, and the modern fix is scheduler.yield(). Any task longer than 50ms on the main thread blocks user interactions for that entire duration. The job is to chop big tasks into chunks under 50ms each and yield the main thread between chunks so that pending input can run.
// Before — one long blocking task
function processItems(items) {
  for (const item of items) {
    expensiveWork(item); // total runtime: 800ms — INP killer
  }
}

// After — yields back to the browser every batch
async function processItems(items) {
  let lastYield = performance.now();
  for (const item of items) {
    expensiveWork(item);
    if (performance.now() - lastYield > 50) {
      await scheduler.yield(); // Chrome 115+
      lastYield = performance.now();
    }
  }
}
scheduler.yield() is the API to use in 2026, not setTimeout(..., 0). The reason: setTimeout(0) puts your continuation at the back of the task queue behind any pending work, while scheduler.yield() preserves the original priority so the browser resumes your code immediately after handling pending input. For browsers that do not yet support it natively, drop in the scheduler-polyfill from Chrome's web team and the same code works everywhere. We talked about how this same pattern compounds with the broader main-thread budget in our deep dive on how to make a website faster.
The other processing-time fix that pays off quickly: separate visual updates from "side effect" code inside event handlers. If a click is supposed to open a menu, the menu open should be the first thing the handler does. Analytics events, prefetches, and validation logic should all run after the visual state has been requested — typically inside a requestAnimationFrame callback or, for non-urgent work, inside requestIdleCallback. This pattern alone often cuts INP by 100-200ms on form-heavy pages.
3. Reduce presentation delay with a smaller DOM
Presentation delay tracks how long the browser spends recalculating styles, doing layout, and painting after your handler finishes. The single biggest lever is DOM size. Pages with 1,500+ DOM nodes pay a measurable penalty on every interaction; pages with 5,000+ nodes — common on builder-generated sites with deeply nested wrappers — are often unrecoverable without restructuring the markup.
Two specific wins here. First, avoid layout thrashing in event handlers: never alternate read DOM → write DOM → read DOM inside the same callback. Batch all reads, then all writes, so the browser can do one layout pass instead of three. Second, use content-visibility: auto on long offscreen sections; the browser will skip layout and paint for content that is not visible, which can shave 50-100ms off interactions on long pages.
How to find your worst INP interactions
You cannot fix what you cannot measure, and INP only shows up in real-user data — it is a field metric, not a lab metric. Three places to look:
- Google Search Console → Core Web Vitals. Group by URL pattern. The pages flagged "Poor" are usually templated pages where the same heavy component (a product filter, a chat widget, a mobile menu) is rendered on every URL.
- Chrome DevTools → Performance panel → Record interaction. Open the page, hit "Record," click the slow thing, stop recording. The Interactions track shows the exact long task that ran, broken into the three INP phases. This is where you find the offending function name.
- The web-vitals JS library (from Google's web team) reports field INP on every page load. Pipe it to your analytics and segment by device, browser, and page template — the worst-performing combination is usually mobile Chrome on a long-template page.
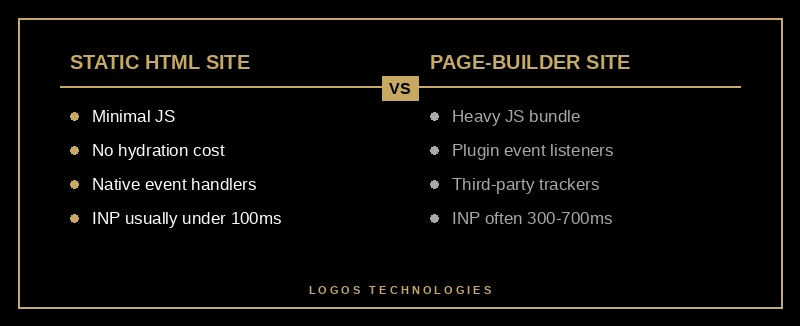
A quick reality check that surprises most site owners: INP is overwhelmingly a problem on dynamic, JavaScript-heavy stacks. Static, hand-coded sites pass INP by default because the user is interacting with native HTML controls (links, native form inputs, CSS-driven menus) that involve almost no JavaScript at all. We argue the architectural case in our piece on why hand-coded custom web design outperforms templated builds, and INP is one of the cleanest examples — there is nothing to optimize because there is nothing in the way.
What does fixing INP do for traffic and revenue?
INP is a ranking signal, but the more interesting impact is on conversion. Google's Web Vitals team published research showing that improving INP from 500ms to 200ms correlates with up to a 22% improvement in user engagement metrics — time on page, pages per session, return visits. The Chromium blog post on the INP launch walks through several case studies in which sites that prioritized INP saw double-digit improvements in conversion rate alongside the ranking lift.
The mechanism is intuitive. Every interaction that takes longer than ~200ms feels broken to a real user; they tap again, blame the site, and bounce. INP is essentially measuring how often your site feels broken on real phones. Sites that feel snappy keep users; sites that feel stuck lose them, and Google's data shows the gap is large enough to matter for any small business depending on organic search.
That is also the connection back to the rest of our website speed optimization guide for 2026 and to the broader Core Web Vitals story. INP, LCP, and CLS are not three independent metrics — they all measure different facets of "how does this page feel to use." A site that is fast to load, stable while it loads, and snappy after it loads is, in the terminology Google has been pushing, a "great page experience." That is the ranking signal. INP is the part of it that small business sites have been quietly failing the most in 2026.
Frequently Asked Questions
What is a good INP score in 2026?
200 milliseconds or less, measured at the 75th percentile of real-user interactions, on the 75th-percentile device. Anything between 200ms and 500ms is "needs improvement," and anything over 500ms is "poor." Note that the threshold applies to your worst-performing page-template-and-device combination — usually mobile Chrome on a long page — not the median.
Did INP replace First Input Delay?
Yes. Interaction to Next Paint replaced First Input Delay as a Core Web Vital on March 12, 2024. INP measures every interaction during a page visit, not just the first one, and includes processing time and presentation delay rather than just the input delay before processing. Most sites that passed FID now fail INP because the metric is genuinely harder.
Is INP a Google ranking factor?
Yes. INP is part of the Core Web Vitals signal inside Google's page experience ranking system, with the same weight as LCP and CLS. The signal is most influential as a tiebreaker — it does not override topical relevance — but on competitive keywords where two pages have similar content authority, the page with better Core Web Vitals (including INP) tends to win.
Why does my site fail INP after switching to a page builder?
Page builders inject large JavaScript bundles, plugin event listeners, and third-party widgets that compete for the main thread on every interaction. Even a "fast" builder typically ships 200-500KB of JavaScript that has to parse, compile, and execute before user input is handled. Static sites built with hand-written HTML and minimal JavaScript usually pass INP under 100ms without any optimization at all, which is the architectural argument for moving off page builders entirely.
How long does it take to fix INP?
For a static site that ships under 100KB of JavaScript, INP is usually fixed by default and there is nothing to do. For a typical WordPress or Webflow site, expect 1-2 weeks of focused work to audit third-party scripts, defer non-critical code, refactor click handlers, and verify the field metric in Search Console. Severely overloaded sites — those with multiple page builders, dozens of plugins, and heavy ad-tech — sometimes cannot be fixed economically and are better rebuilt on a static foundation.
Build for INP from the First Commit
INP is the cleanest argument we have ever seen for the static-site approach to web design. Every other optimization on a heavy stack is a workaround for a problem the architecture created — defer this script, polyfill that scheduler, lazy-load the third thing. A site built on hand-written HTML and a tiny JavaScript footprint never has the problem in the first place. The browser is fast; user input is fast; there is nothing in the middle to slow it down.
That is what we build at LOGOS Technologies. We design and hand-code static, performance-first websites for small businesses out of Papillion, Nebraska, and our typical INP sits well under 100ms because there is almost no JavaScript on the critical interaction path. If you have a Search Console alert telling you INP is poor, or you are looking at a rebuild and want a site that will not have this conversation again in 2027, take a look at our web design services or contact us and we will run a free Core Web Vitals audit on your current site.